| Document |
|
| I. Overview |
| A. What can MoNetFamily do for you? |
| B. Module-module interaction networks |
| C. What is the module family? |
| II. How do I ... |
| A. Query one or multiple interesting protein(s)? |
| B. Analyze query protein(s) through MMI network? |
| C. Analyze query protein(s) through the module family? |
| III. Explanation of all these scores |
| A. Hit ratio |
| B. E-value |
| C. Joint E-value |
| D. Module-module interaction (p-value) |
| E. GO term annotation with consensus ratio and adjusted p-value |
| F. Protein alinged ratio (PAR) and PPI aligned ratio (PPIAR) |
| IV. Data set and Tools |
|
| Overview: |
|
What can MoNetFamily do for you? |
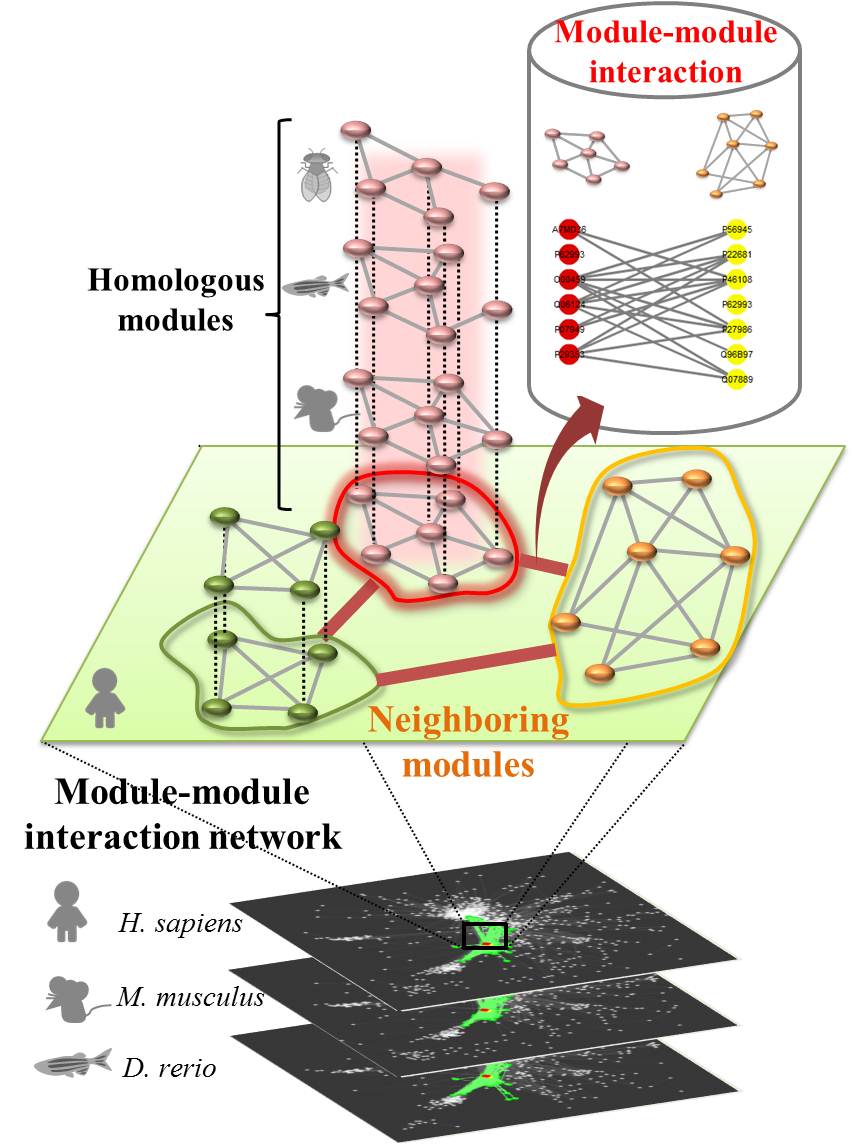
A module is a fundamental unit forming with highly connected proteins and performs a certain kind of biological functions. Modules and module-module interaction (MMI) network are essential for understanding cell mechanisms and functions. The MoNetFamily web server can identify the modules, homologous modules (called module family), and MMI networks across multiple species for the query protein(s). This server first finds module candidates of the query by using BLASTP to search the module template database. MoNetFamily then infers the homologous modules of the selected module candidate using protein-protein interaction (PPI) families. According to homologous modules and PPIs, we statistically calculated MMIs and MMI networks across multiple species. For each module candidate, MoNetFamily identifies its neighboring modules and their MMIs in module networks of H. sapiens, M. musculus, and D. rerio. Finally, MoNetFamily shows the conserved proteins, PPI profiles, and functional annotations of the module family.
|
|
|
|
Module-module interaction network |
Our derived MMI network can reflect the communication of five major cellular processes, including nucleic acid metabolic process (e.g., transcription); protein metabolic process (e.g., translation); intracellular signal transduction process; integrin-mediated signal transduction process; and transport process. This MMI network presents the kernel processes (e.g., central dogma) performing the fundamental cellular metabolisms, that are transcription of nucleic acid metabolic process and translation of protein metabolic process. Signal transduction and transport processes, locating in cell membrane and cytoplasm, are the peripheral portion of the MMI network and communicate with two kernel processes. For example, the figure shows that our derived MMI network was used to analyze the cell proliferation behavior via stimulations of the extracellular matrix proteins and growth factors
|

|
|
What is the Module family? |
The concept of the module family is analogous to the concepts of protein sequence family and protein structure family and PPI family. Here, we use the module template T with three proteins (A, B, and C) and three PPIs (A-B, A-C and B-C) as an example to define the homologous modules of T as follows:
(1) A', B' and C' are the homologous proteins of A, B and C, respectively, with the significant sequence similarity (BLASTP E-values ≤ 10-10) (Matthews et al., 2001; Yu et al., 2004).
(2) A'-B', A'-C' and B'-C' are the homologous PPIs of A-B, A-C and B-C, respectively, with significant joint sequence similarity (joint E-value ≤ 10-40) (Chen et al., 2009).
(3) High topology similarity (i.e., protein aligned ratio and PPI aligned ratio) between modules A'-B'-C' and A-B-C. The protein aligned ratio (PAR) or PPI aligned ratio (PPIAR) is defined as x/X, where x and X are the numbers of proteins (or PPIs) in the homologous module (e.g., A'-B'-C') and template (e.g., A-B-C). Here, the protein aligned ratio ≥ 0.5 and PPI aligned ratio ≥ 0.3 are considered as topology similarity between two modules.
|
|
|
| How do I ... |
Query one or multiple interesting protein(s)? |
| In MoNetFamily server, we allow users to input a set of gene name(s), UniProtKB accession number(s), or a set of protein sequence(s) with FASTA format as the query.
|
|
| The inputted sequences are in FASTA format consists of a single-line description, followed by lines of sequence data. The first character of the description line is a ">" symbol in the first column. For example: |
>sp|Q62120|JAK2_MOUSE Tyrosine-protein kinase JAK2 OS=Mus musculus GN=Jak2 PE=1 SV=2
MGMACLTMTEMEATSTSPVHQNGDIPGSANSVKQIEPVLQVYLYHSLGQAEGEYLKFPSG
EYVAEEICVAASKACGITPVYHNMFALMSETERIWYPPNHVFHIDESTRHDILYRIRFYF
PHWYCSGSSRTYRYGVSRGAEAPLLDDFVMSYLFAQWRHDFVHGWIKVPVTHETQEECLG
MAVLDMMRIAKEKDQTPLAVYNSVSYKTFLPKCVRAKIQDYHILTRKRIRYRFRRFIQQF
SQCKATARNLKLKYLINLETLQSAFYTEQFEVKESARGPSGEEIFATIIITGNGGIQWSR
GKHKESETLTEQDVQLYCDFPDIIDVSIKQANQECSNESRIVTVHKQDGKVLEIELSSLK
EALSFVSLIDGYYRLTADAHHYLCKEVAPPAVLENIHSNCHGPISMDFAISKLKKAGNQT
GLYVLRCSPKDFNKYFLTFAVERENVIEYKHCLITKNENGEYNLSGTKRNFSNLKDLLNC
YQMETVRSDSIIFQFTKCCPPKPKDKSNLLVFRTNGISDVQISPTLQRHNNVNQMVFHKI
RNEDLIFNESLGQGTFTKIFKGVRREVGDYGQLHKTEVLLKVLDKAHRNYSESFFEAASM
MSQLSHKHLVLNYGVCVCGEENILVQEFVKFGSLDTYLKKNKNSINILWKLGVAKQLAWA
MHFLEEKSLIHGNVCAKNILLIREENRRTGNPPFIKLSDPGISITVLPKDILQERIPWVP
PECIENPKNLNLATDKWSFGTTLWEICSGGDKPLSALDSQRKLQFYEDKHQLPAPKWTEL
ANLINNCMDYEPDFRPAFRAVIRDLNSLFTPDYELLTENDMLPNMRIGALGFSGAFEDRD
PTQFEERHLKFLQQLGKGNFGSVEMCRYDPLQDNTGEVVAVKKLQHSTEEHLRDFEREIE
ILKSLQHDNIVKYKGVCYSAGRRNLRLIMEYLPYGSLRDYLQKHKERIDHKKLLQYTSQI
CKGMEYLGTKRYIHRDLATRNILVENENRVKIGDFGLTKVLPQDKEYYKVKEPGESPIFW
YAPESLTESKFSVASDVWSFGVVLYELFTYIEKSKSPPVEFMRMIGNDKQGQMIVFHLIE
LLKSNGRLPRPEGCPDEIYVIMTECWNNNVSQRPSFRDLSLRVDQIIAA
>sp|Q62035|PTAFR_MOUSE Platelet-activating factor receptor OS=Mus musculus GN=Ptafr PE=1 SV=1
MEHNGSFRVDSEFRYTLFPIVYSVIFILGVVANGYVLWVFANLYPSKKLNEIKIFMVNLT
MADLLFLITLPLWIVYYYNEGDWILPNFLCNVAGCLFFINTYCSVAFLGVITYNRYQAVA
YPIKTAQATTRKRGISLSLIIWVSIVATASYFLATDSTNLVPNKDGSGNITRCFEHYEPY
SVPILVVHVFIAFCFFLVFFLIFYCNLVIIHTLLTQPMRQQRKAGVKRRALWMVCTVLAV
FIICFVPHHVVQLPWTLAELGYQTNFHQAINDAHQITLCLLSTNCVLDPVIYCFLTKKFR
KHLSEKFYSMRSSRKCSRATSDTCTEVIVPANQTPIVSLKN
>tr|Q3U447|Q3U447_MOUSE Putative uncharacterized protein OS=Mus musculus GN=Tyk2 PE=2 SV=1
MVGTMPLCGRRAILEDSKADGTEAQPLVPTGCLMVLLHWPGPEGGEPWVTFSQTSLTAEE
VCIHIAHKVGITPPCLNLFALYNAQAKVWLPPNHILDTSQDMNLYFRMRFYFRNWHGMNP
QEPAVYRCGFPGAETSSDRAEQGVQLLDSASFEYLFEQGWYVGNRAKSSHTSFSIHRSTP
QGKHEFMNDVVSLRDLSSEEEIHHFKNESLGMAFLHLCHLALSRGVPLEEMAREISFKNC
IPHSFRQHIRQHNVLTRLRLRRVFRRFLRAFRPGHLSQQVVMVKYLATLERLAPRFGSER
IPVCHLEVLAQPERDPCYIQNSGQTAGDPGPELPSGPPTHEVLVTGTGGIQWHPLQTQES
ERGNSRGNPHGSRSGKKPKAPEAGEHLTESPQEPPWTYFCDFQDISHVVLKERRVHIHLQ
DNKCLLLCLCSQAEALSFVALVDGYFRLTADSSHYLCHEVAPPRLVTSIQNGIHGPLMDP
FVQAKLWPEDGLYLIQWSTSHLHRLILTVAHRNPALSNGPRGLRLRKFPITQQPGAFVLD
GWGRSFASLGDLRLALQGCSLRAGDDCFPLHHCCLPRPREISNLVIMRGSRAHTRPLNLS
QLSFHRVHQDEITQLSHLGQGTRTNVYEGLLRVGGPDEGKVDNGCPPEPGGTSGQQLRVV
LKVLDPSHHDIALAFYETASLMSQVSHMHLAFLHGVCVRGSENIIVTEFVEHGPLDVWLR
RQRGQVPMTWKMVVAQQLASALSYLEDKNLVHGNVCGRNILLARLGLEEGTNPFIKLSDP
GVGQGALSREERVERIPWTAPECLSGGTSSLGTATDMWGFGATLLEICFDGEAPLQGRGP
SEKERFYTKKHQLPEPSSPELATLTRQCLTYEPAQRPSFRTILRDLTRLQPQNLVGTSAV
NSDSPASDPTVFHKRYLKKIRDLGEGHFGKVSLYCYDPTNDGTGEMVAVKALKEGCGPQL
RSGWQREIEILRTLYHEHIVKYKGCCEDQGEKSVQLVMEYVPLGSLRDYLPRHCVGLAQL
LLFAQQICEGMAYLHAQHYIHRDLAARNVLLDNDRLVKIGDFGLAKAVPEGHEYYRVRED
GDSPVFWYAPECLKECKFYYASDVWSFGVTLYELLTYCDSNQSPHMKFTELIGHTQGQMT
VLRLTELLERGERLPRPDRCPCEIYHLMKNCWETEASFRPTFQNLVPILQTAQEKYQGQV
PSVFSVC
|
|
Analyze query protein(s) through the MMI network? |
| This server first finds module candidates of the query by using BLASTP to search the module template database (1,785 experimental and 1,252 structural templates).
For each module candidate, MoNetFamily identifies its neighboring modules and their MMIs in module networks of H. sapiens, M. musculus, and D. rerio through homologous modules. For a module family and its neighboring modules, we measured the consensus ratios and adjusted p-values of BP, CC, and MF based on GO annotations (red box).
Additionally, this server provides MMI topology (inter-module PPIs) to show interaction details between query module (center module) and its neighboring modules (select module).
Finally, this server provides graphic visualization of the neighboring modules and MMIs in the MMI networks across multiple vertebrates.
|
Analyze query protein(s) through Module family? |
| For each module candidate of query protein(s), the MoNetFamily server shows the conserved proteins, PPI profiles, and functional annotations of the module family.
1. Proteins of the module family
2. PPI profile of the module family
3. Functional annotations of the module family
|
Homologous modules in each organism ( Ranking by Hit ratio ) |
| This server will return all of homologous modules of each species, which are ranked by hit ratio of each homologous module. |
|
Division group |
| For clustering the organisms simplely, we selected and clustered the division names of NCBI taxonomy database into five division groups, including mammals (MAM), vertebrates (VRT), invertebrates (INV), plants (PLN) and bacteria (BCT). The PLN division group includes plants and fungi (e.g., S. cerevisiae). |
|
|
| Explanation of all these scores: |
Hit ratio |
| For each hit module of the query, the hit ratio is the number of homologous proteins divided by total number of query sequences. |
|
E-value |
| The E-value specifies the statistical significance of an alignment to obtain an indication of the reliability of the searching. This setting is a threshold for reporting matching protein sequences against sequence database. We followed previous works (Matthews et al., 2001; Yu et al., 2004) to define 10-10 as the default value. Operationally, homologous proteins can be defined as having an E-value 10-10 from BLAST. If the E-value is greater than 10-10, the match will not be reported. Lower E-value is more stringent, causing to fewer number of matches being reported. |
|
Joint E-value |
Joint E-value is a quantitative degree to measure the similarity between two protein pairs. We followed previous works (Matthews et al., 2001; Yu et al., 2004) to define the joint sequence similarity as

where EA denotes the E-value of proteins A and its homolog A'; and EB is the E-value of proteins B and its homolog B'.
|
|
Module-module interaction (p-value) |
The module-module interaction (MMI) can be quantified by the PPIs between two modules. Here, we decided the MMI based on the p-value of the hypergeometric distribution (Bandyopadhyay et al., 2010) defined as

where x is observed annotated inter-module PPIs; i and n are the numbers of annotated inter-module PPIs and all combinational protein pairs between two modules, respectively; M and N are total numbers of annotated inter-module PPIs and all combinational protein pairs between any two modules in a MMI network, receptively.
Here, the MMI between two modules should satisfy two criteria: (1) p-value ≤ 10-4; (2) at least two proteins of a module participate in inter-module PPIs.
|
|
GO term annotation with consensus ratio and adjusted p-value |
| To annotate a module family with F homologous modules, we define a consensus ratio of GO term as CRF = Fa / F, where Fa is the number of homologous modules with GO term in a module family. The enrichment (adjusted p-value ≤ 0.05) for each module in each GO term is determined by the p-value of the hypergeometric distribution and the p-value is adjusted based on Bonferroni correction (Medina et al., 2010; Boyle et al., 2004). Here, a GO term (BP, MF, or CC) is considered to annotate a module family if CRF > 0.6.
|
|
Protein alinged ratio (PAR) and PPI aligned ratio (PPIAR) |
| The protein aligned ratio (PAR) or PPI aligned ratio (PPIAR) is defined as x/X, where x and X are the numbers of proteins (or PPIs) in the homologous module (e.g., A'-B'-C') and template (e.g., A-B-C). Here, the protein aligned ratio ≥ 0.5 and PPI aligned ratio ≥ 0.3 are considered as topology similarity between two modules.
|
|
|
| Data set and Tools |
| MoNetFamily contains information from 1,975 module families, derived from CORUM and PDB database. The details would be downloaded in the tables as follow:
|
|
| Sources |
Number of modules
(≥ 3 proteins) |
Number of non-redundant modules in each set |
Number of non-redundant modules |
| CORUM |
1,785
(Download) |
1,519 |
1,975
(Download) |
PDB
(biological units) |
1,252
(Download) |
457 |
|
|
| We had like to extend out thanks to several groups, software packages, projects, and data repositories that have helped to make MoNetFamily possible:
|
|
The MIPS CORUM complex database
The PDB database
The IntAct, MIPS, DIP, MINT, BioGRID, PPISearch and PCFamily interaction database
The Integr8 complete genomic database
The NCBI taxonomy database
The Gene Ontology (GO) annotation database
The KEGG Module database
Cytoscape web
Babelomics and GO-TermFinder
|